Explain Mean, Median, Mode, Variance, Standard Deviation & five number summary with suitable database example.
-
Mean
-
Mean is the average of a dataset.
-
To find the mean, calculate the sum of all the data and then divide by the total number of data
-
Example : Find out mean for 12, 15, 11, 11, 7, 13
-
First, find the sum of the data. : 12 + 15 +11 + 11 + 7 + 13 = 69
-
Then divide by the total number of data. : 69 / 6 = 11.5
-
Therefore, Mean = 11.5
-
Median
-
Median is the middle number in a dataset when the data is arranged in numerical order (Sorted Order).
-
If count is Odd then middle number is Median
-
If count is Even then take average of middle two numbers that is Median
-
Example : Find out Median for 12, 15, 11, 11, 7, 13, 15
- In above example, count of data is 7. (Odd)
-
First, arrange the data in ascending order. :
7, 11, 11, 12, 13, 15, 15
-
Partitioning data into equal halfs
7, 11, 11, 12, 13, 15, 15
-
Therefore, The Median = 12
-
Mode
-
The mode is the number that occurs most often within a set of numbers.
-
Example : Find mode. :
12, 15, 11, 11, 7, 13
-
As 11 is repeated maximum time, Mode = 11
-
Standard Deviation
-
The Standard Deviation is a measure of how spread out any data are.
-
Its symbol is s (the Greek letter sigma)
-
Sample Variance : (s)2 = 1/(π - 1 ) Σi=1n(x - mean)2
-
Standard Deviation is Square root of sample variance.
-
Example : The owner of the Indian restaurant is interested in how much people spend at the restaurant.
He examines 10 randomly selected receipts for parties and writes down the following data. : 44, 50, 38, 96, 42, 47, 40, 39, 46, 50
-
Ans :
-
Find out Mean
-
Write a table that subtracts the mean from each observed value.
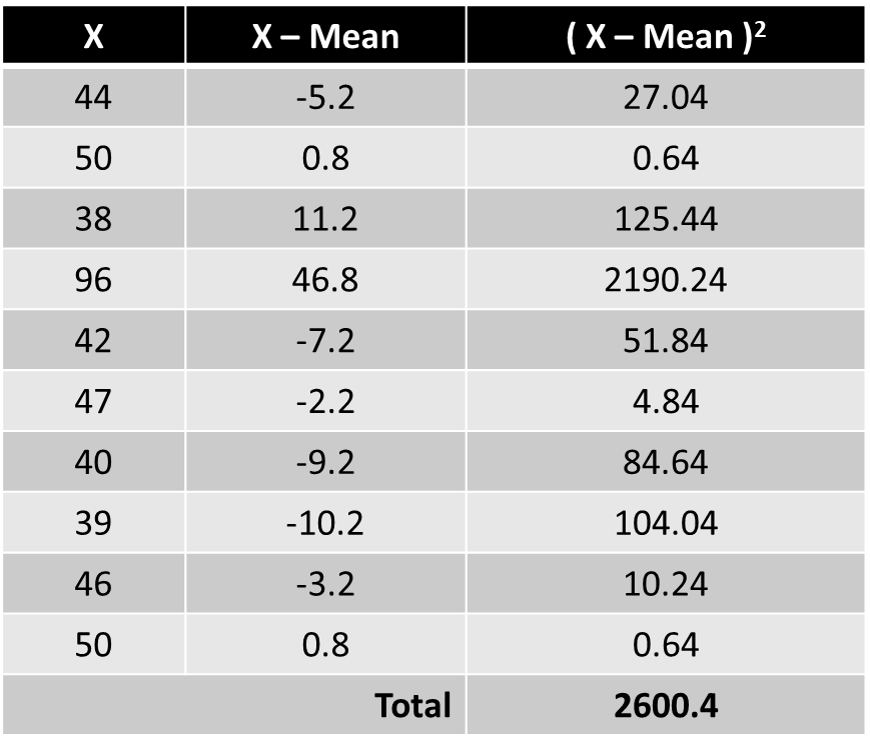
-

-
